Bar graphs are great for comparing, while line graphs are great for presenting trends. But if you’re looking to convey percentages of a whole at a certain time, it’s best you use pie charts.
However, how do you make a pie chart in Notion?
Table of Contents
How to Make a Pie Chart in Notion
Pie charts are a fun and colorful means of presenting data in percentages of a whole. This type of chart works best to find out how much an item contributes to the whole.
Hence, if you want to make a Notion budget template, use a pie chart to show how your expenses monthly are broken into different categories.
Like line graphs and bar graphs, you can make the pie chart from Google Sheets or use a third-party chart maker tool like Notion Charts.
But if you’re tech-savvy, then building one using code blocks is another method you can do.
How to Make a Pie Chart in Notion Using Google Sheets
Aside from not having to create an account, making a pie chart with Google Sheets also allows for automation.
This way, you can add new entries to the pie chart without redoing the whole pie chart to add those new entries.
Simply embed it in your Notion workspace like a widget for it to work.
If you are convinced that this method is the best way of making the pie chart for you, follow these steps:
1. Select the columns and rows of the table for the pie chart you’ll create.
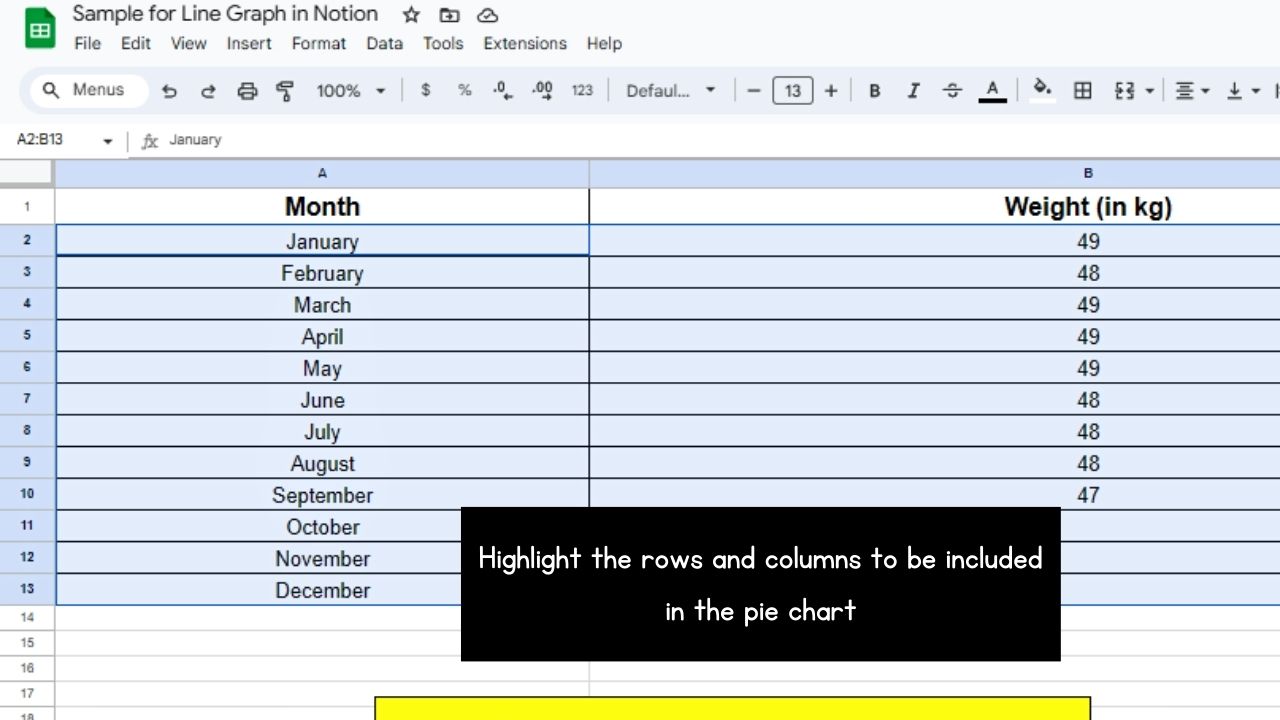
Do this by dragging the cursor across those entries until they’re covered in blue highlight.
2. Select the “Chart” option.
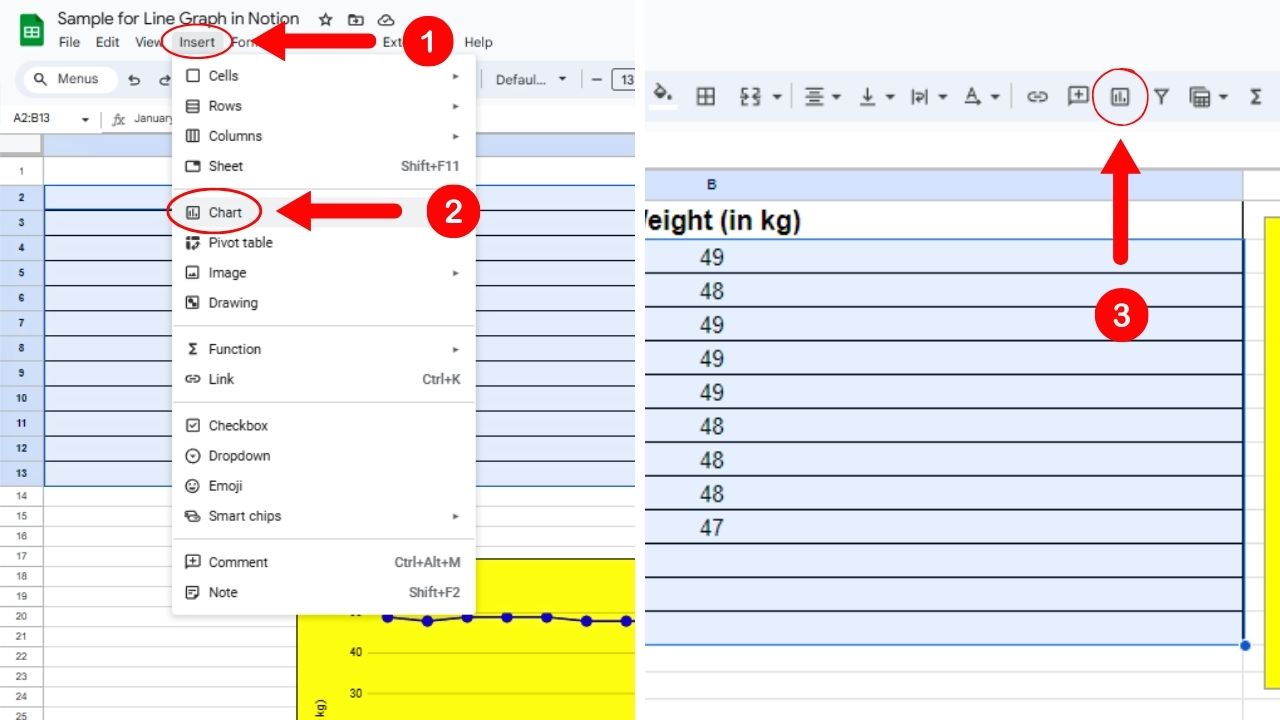
One way to do this is by clicking “Insert” on the menu bar and selecting “Chart” on the dropdown menu.
Another way is to select the “Chart” button on the taskbar.
Either of these methods opens the “Chart Editor” pane on the Sheets document’s right side.
3. Go to the “Chart Type” section, click the “Down” button, and select a pie chart.
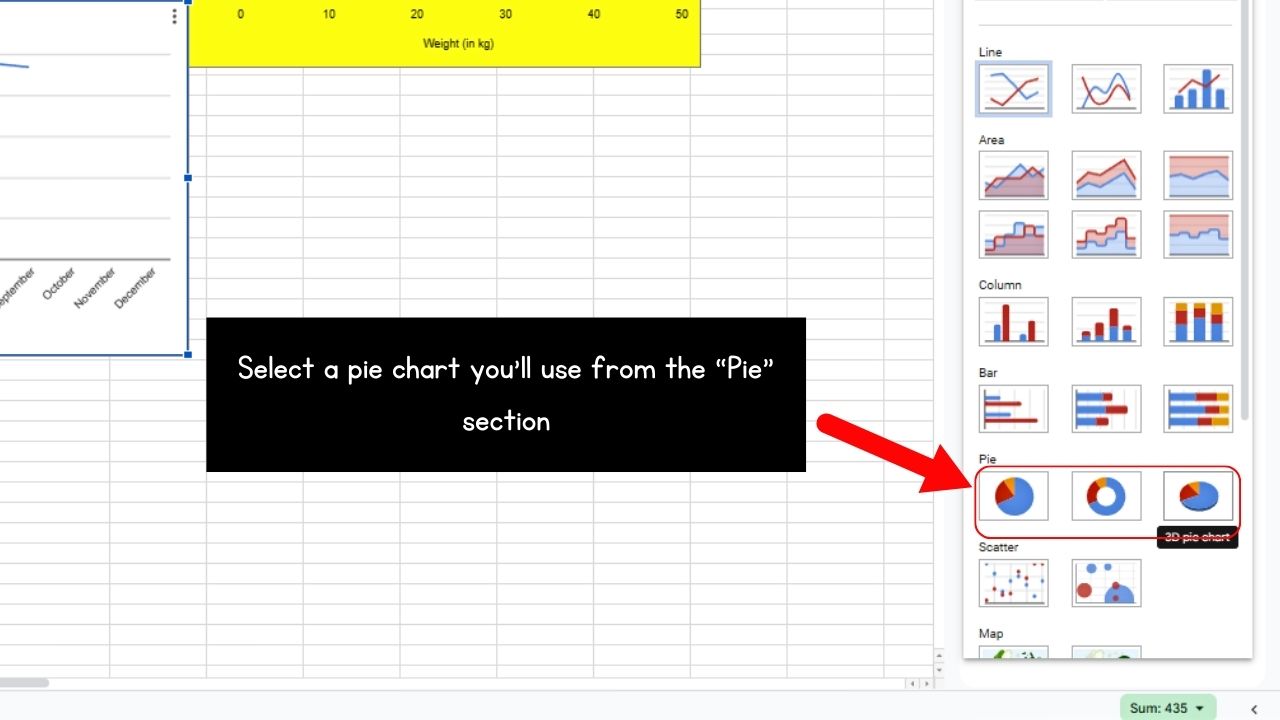
The “Pie” section is found between the “Bar and “Scatter” sections on the “Chart Editor” pane.
Then select whether you’ll use a regular pie chart, a doughnut chart (a pie chart with a hole at the center), or a 3D pie chart.
After which, you’ll see the pie chart you selected on a chart window in the Sheets document.
4. Type the cells to be included in the pie chart.
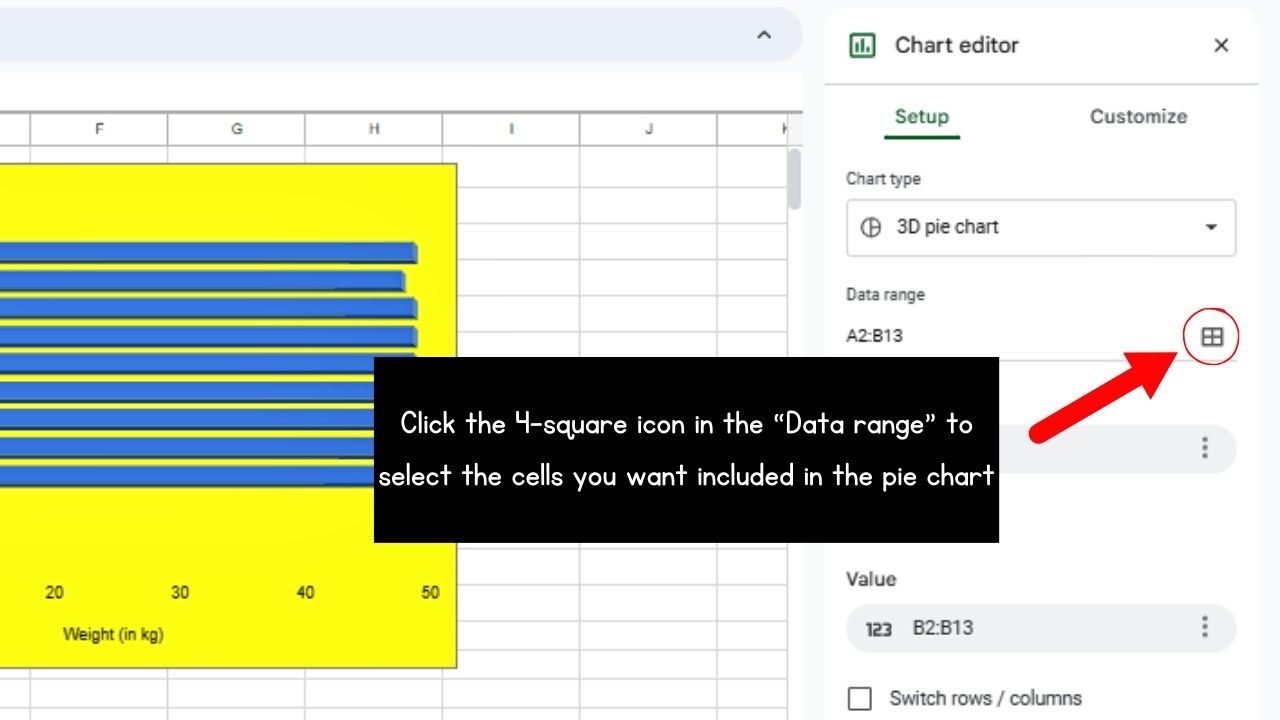
Select the 4-square button under the “Data range” section. Then manually type the cells or click the “Suggested” range.
Then select “OK” to exit the “Select a Date Range” window.
5. Tick the box for “Use Column A as labels.”
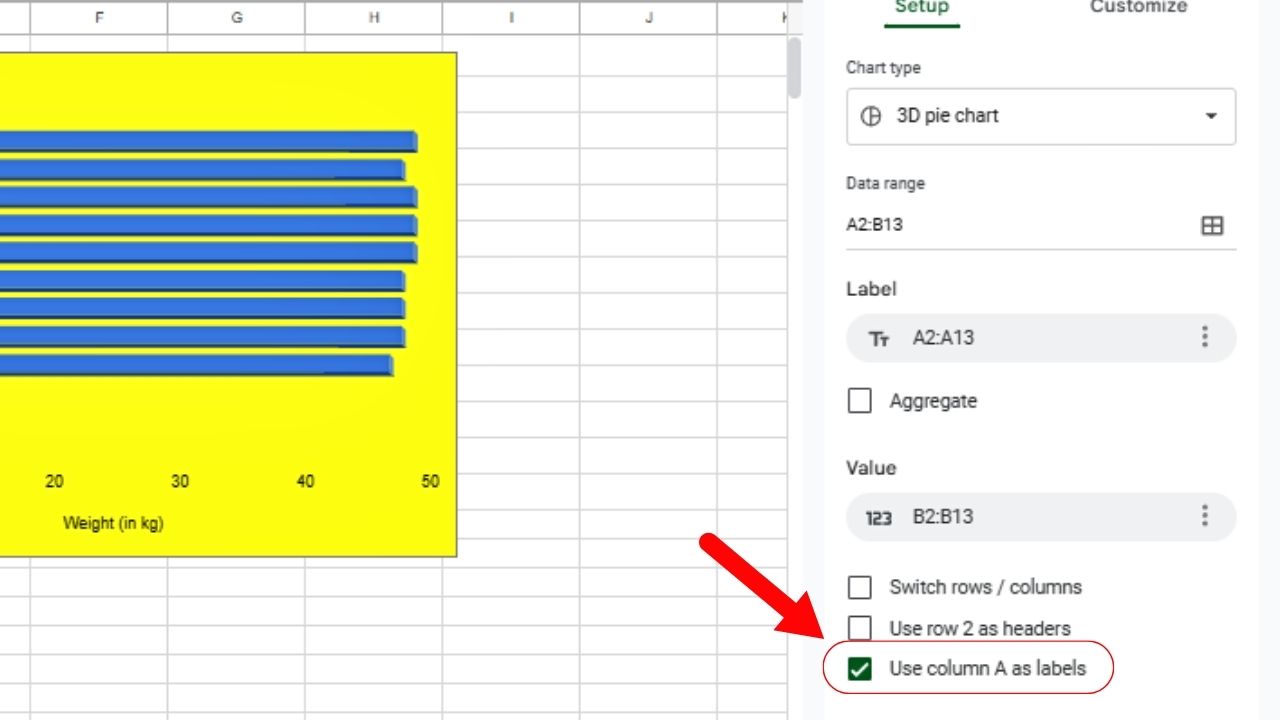
This ensures that the table’s column headers become the pie chart’s labels.
6. Select “Customize” and edit the pie chart.
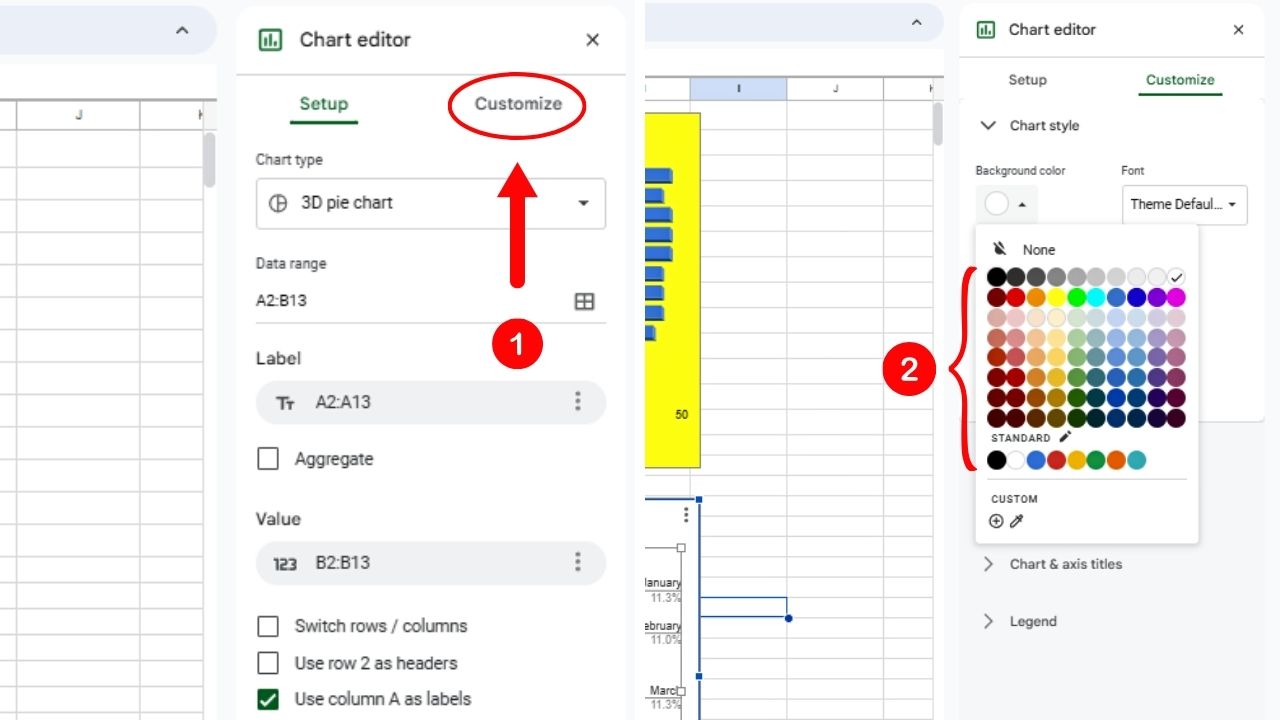
In the “Chart Style” section, select the pie chart’s background by clicking on the hue you want.
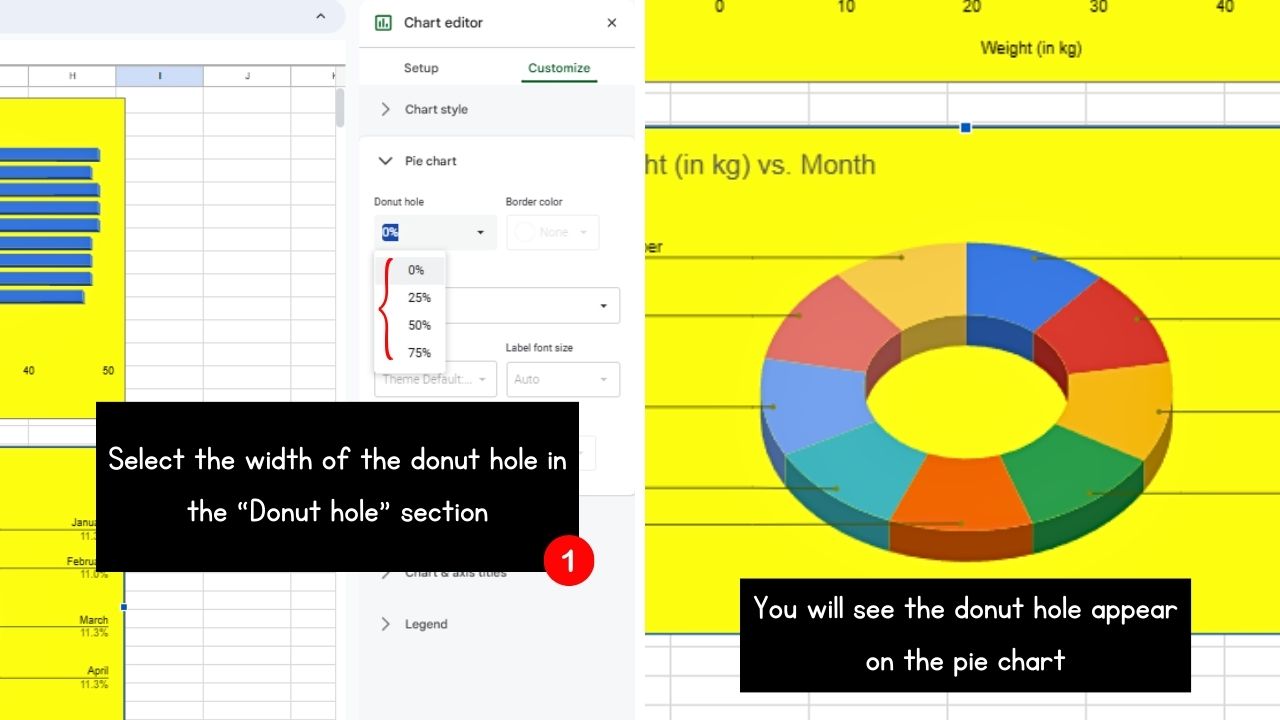
You can also opt to add a donut hole to the pie chart by opening the “Pie chart” section. Then click the “Down” button of the “Donut hole” section and select the width of the hole in percentage.
You can also select the “Slice label” by clicking the “Down” button and clicking one of the options in the dropdown menu.
You can also assign colors for the pie chart’s slices in the “Pie Slice” section.
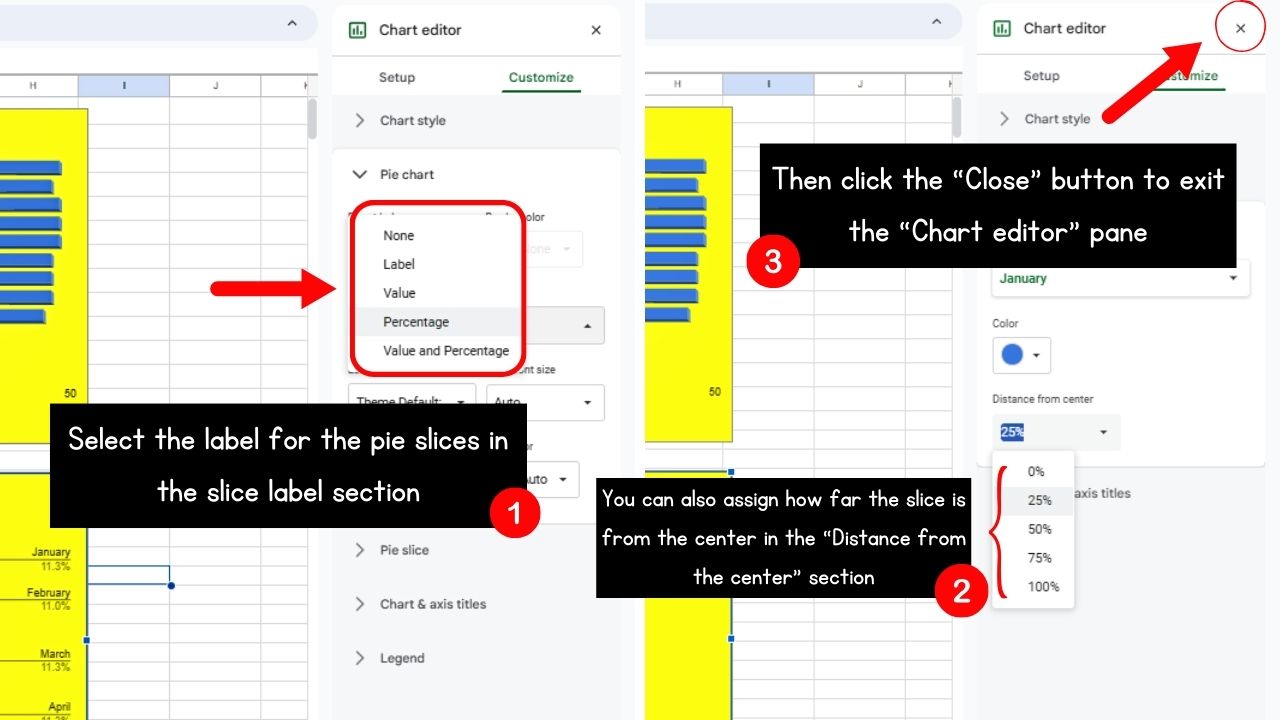
Then click “Close” to exit the “Chart Editor” pane.
7. Click the 3-dot icon and select “Publish chart.”
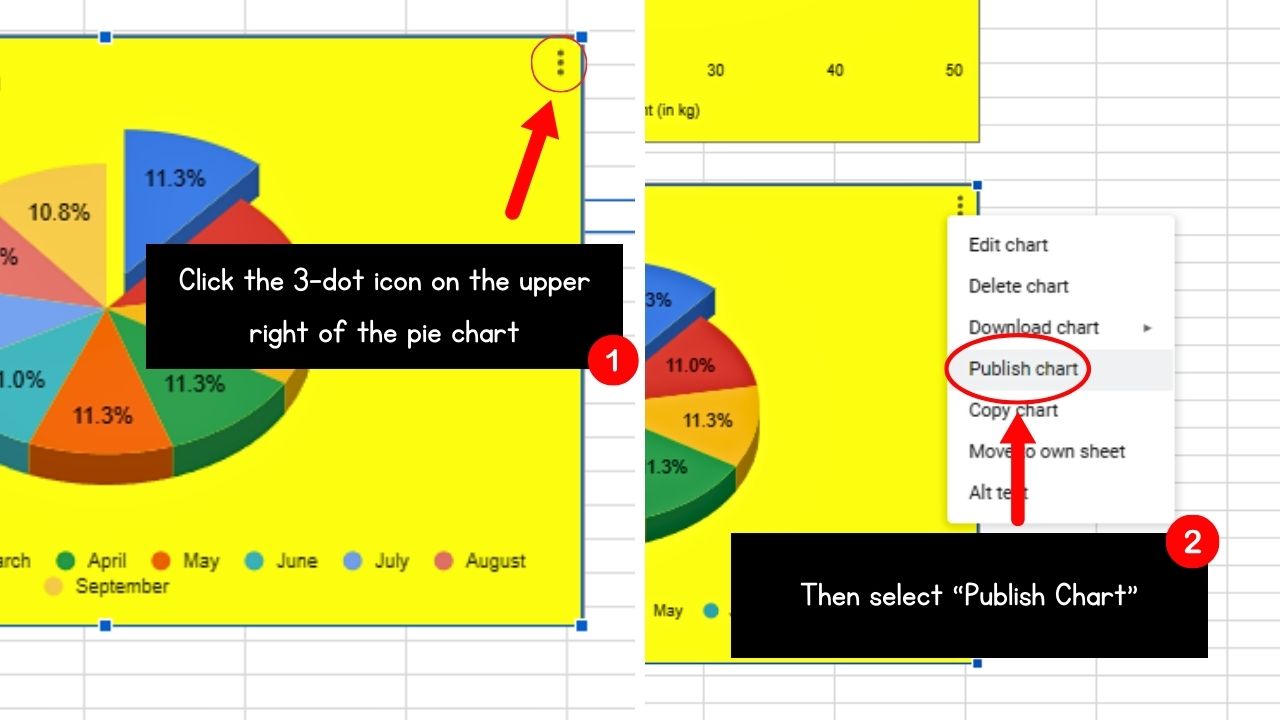
You’ll only see this if you hover the cursor on the pie chart’s top right corner. Then you’ll find the “Publish chart” option between “Download chart” and “Copy chart.”
The “Publish to the web” window then opens.
8. Select the “Embed” tab and click “Publish.”
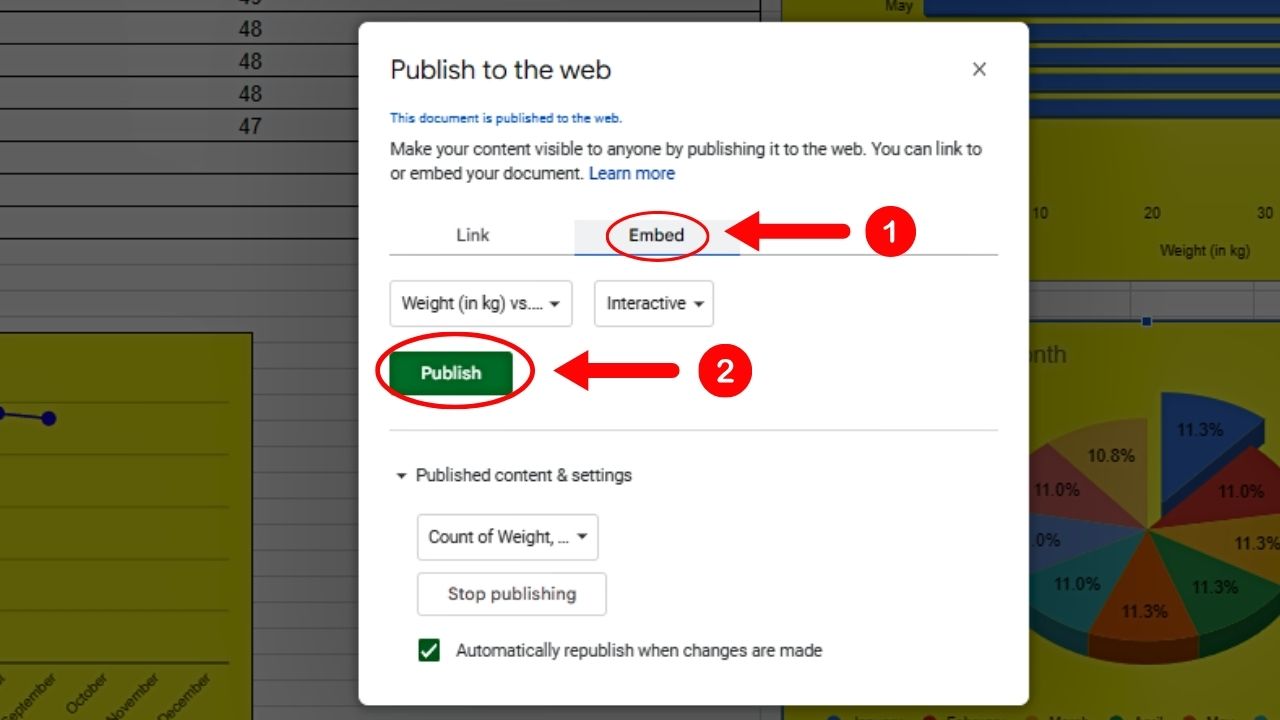
Since links don’t display properly when directly pasted on Notion, select the “Embed” tab and click the “Publish” button.
Then select “OK.”
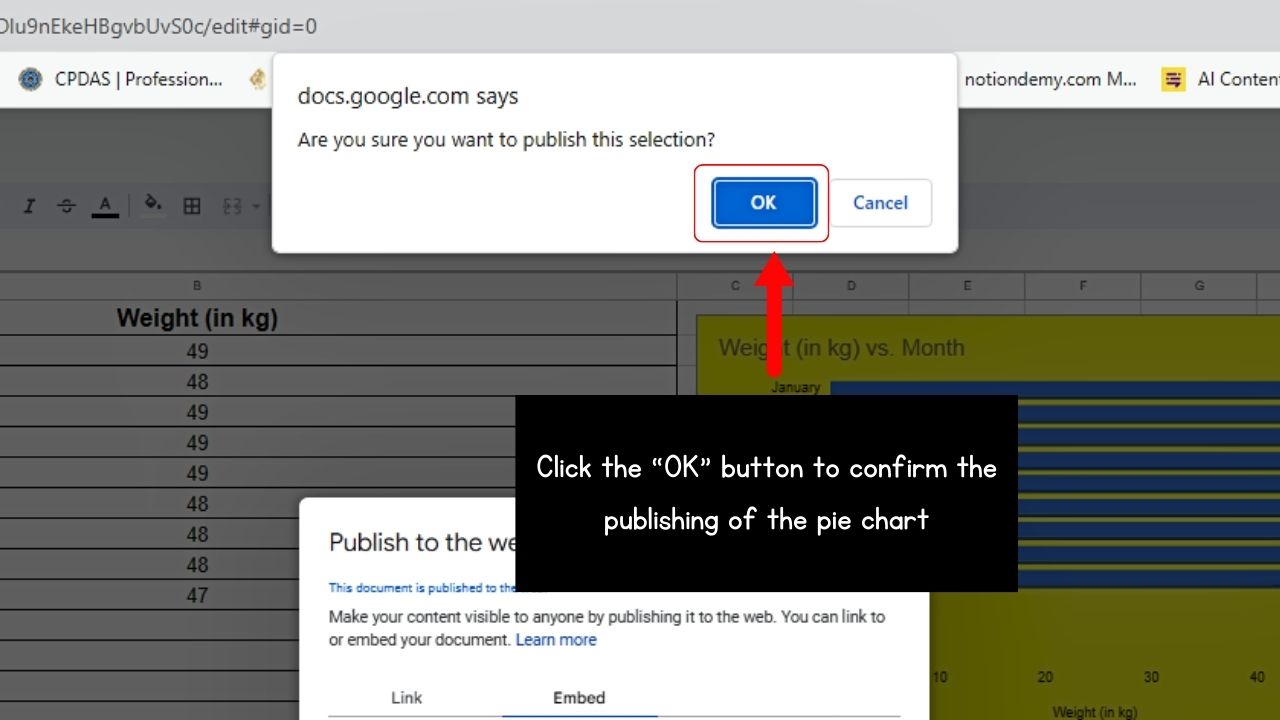
9. Copy the embed code of the pie chart and paste it to Notion.
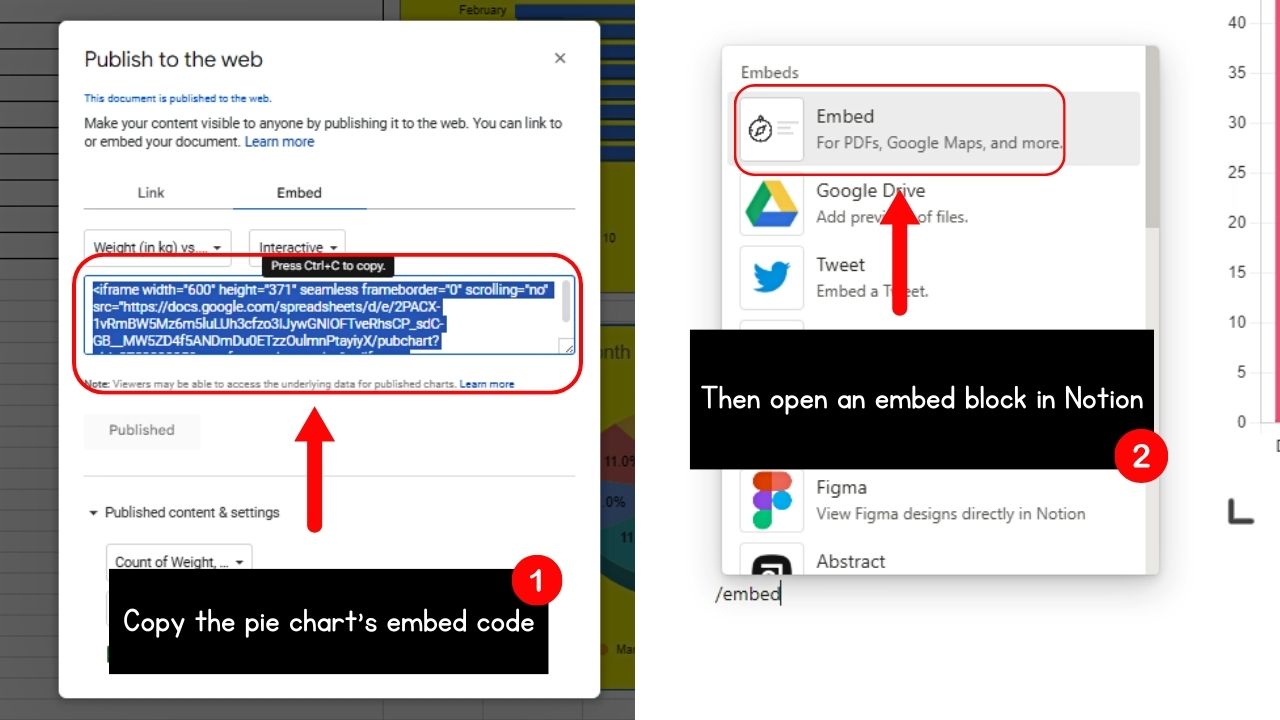
This code is found above the greyed-out “Published” button. Highlight it and open an embed code in your Notion workspace.
Then paste the pie chart’s embed code before you select the “Embed link” button.
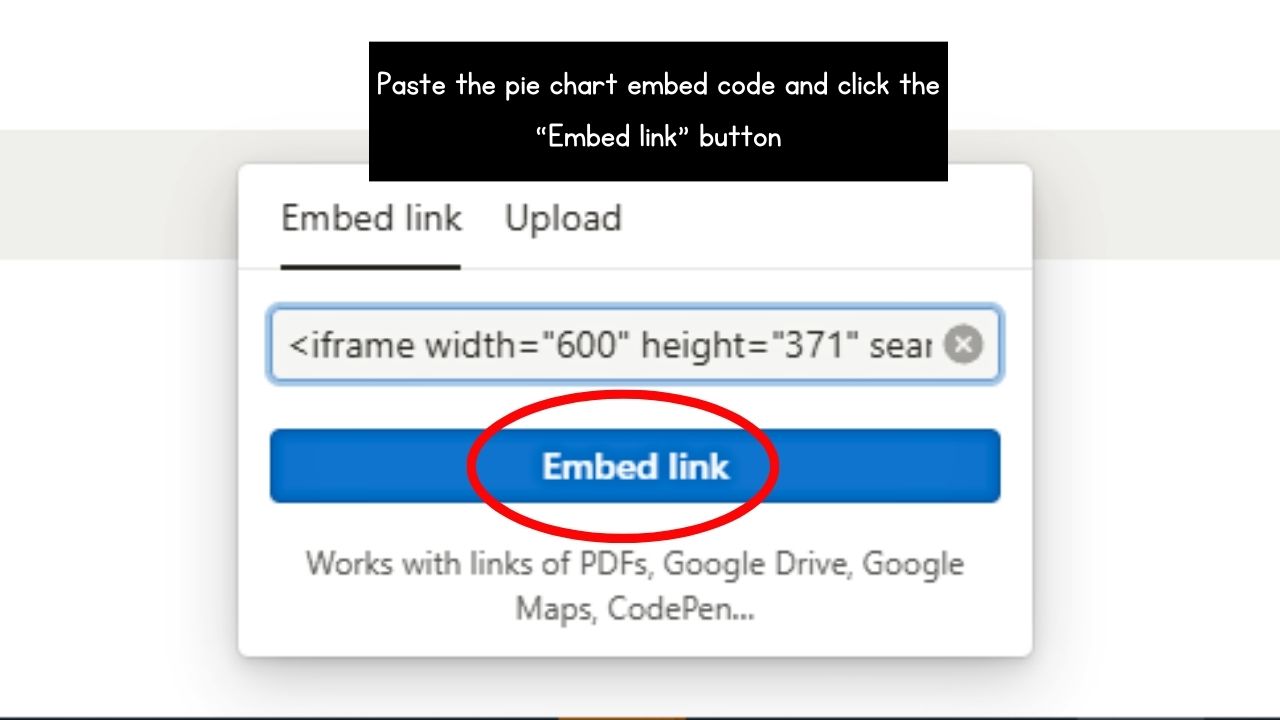
You should now see the pie chart you created from Google Sheets on your Notion workspace.
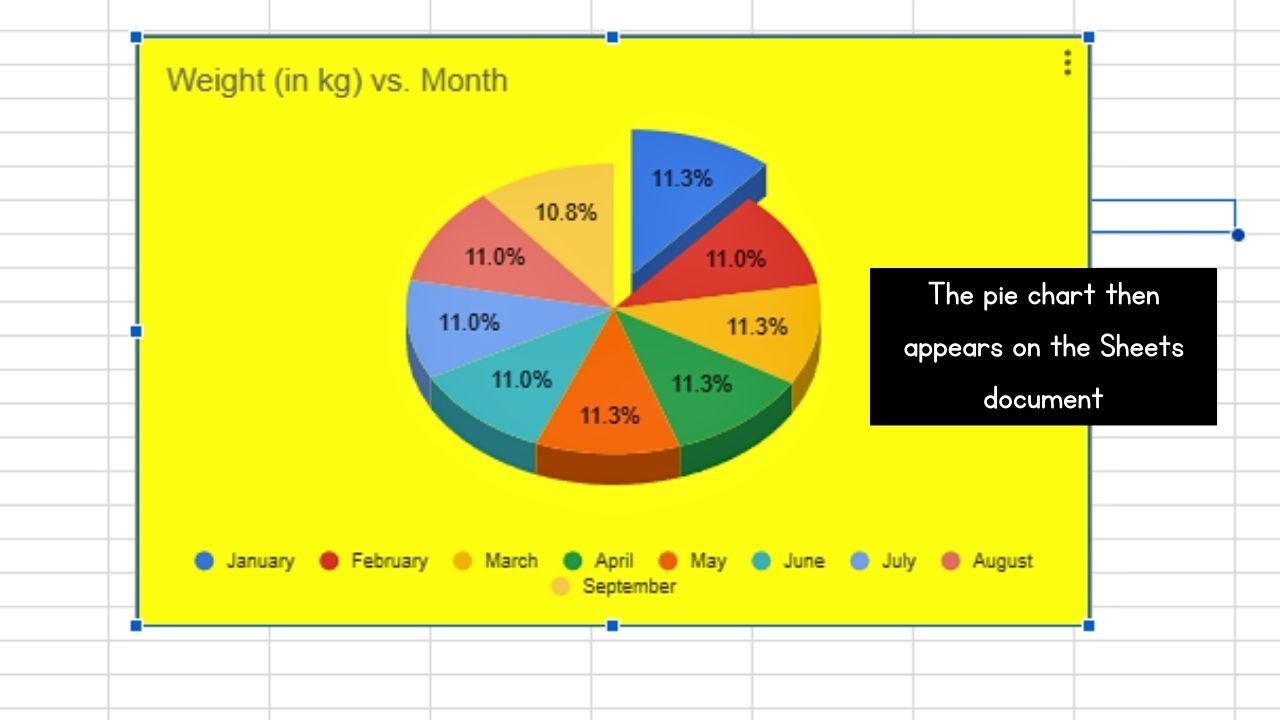
If you need to add new entries or make changes to the pie chart, simply go back to the table in Google Sheets and edit them. Those changes should reflect in the pie chart.
How to Make a Pie Chart in Notion Using Notion Charts
Notion Charts allows you to create any type of graph, including pie charts, without having to create an account.
This is because Notion Charts creates the chart from a table you made on Google Sheets using certain details.
After opening the Notion Charts site, do the following:
1. Select the “Create a Chart” button.
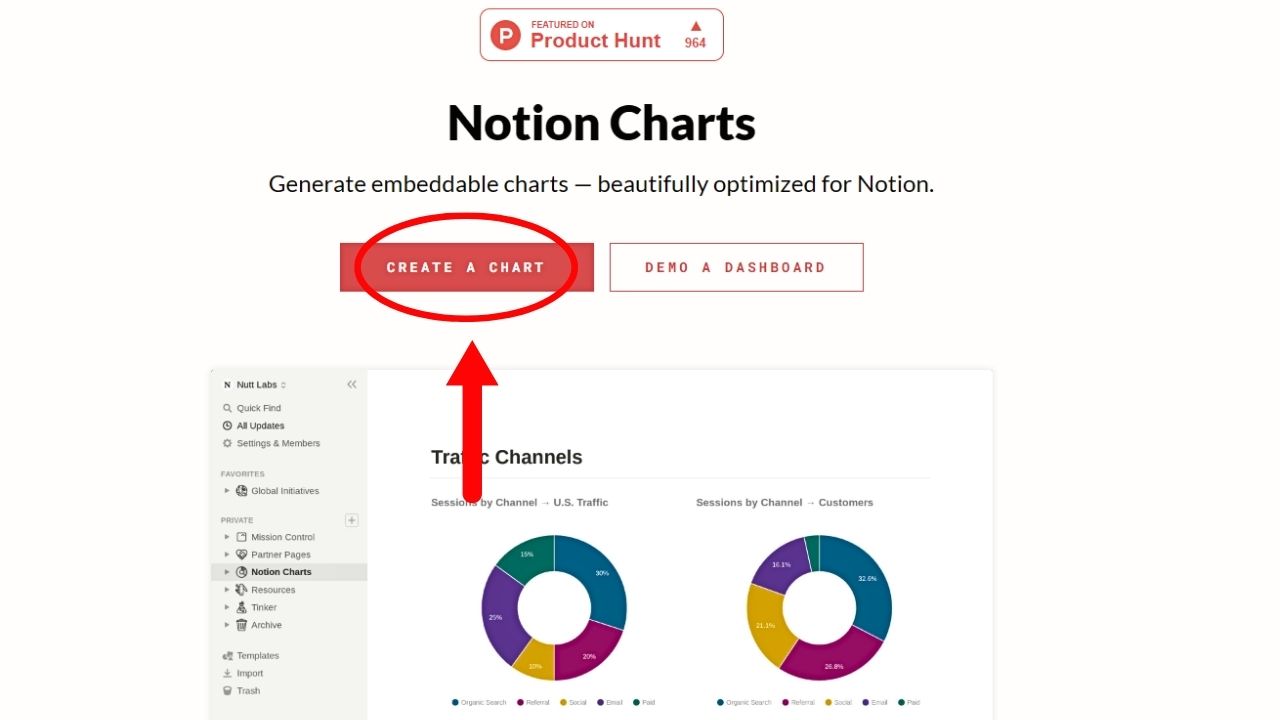
You’ll see this beside the “Send a Dashboard” button under Notion Charts’ tagline.
You’re then redirected to the “Connect Your Google Sheet” section.
2. Go back to Google Sheets and edit its viewing access.
This ensures that the pie chart appears on Notion once you embed it.
Do this by clicking on the “Share” button of the Sheets page and changing the “Restricted Access” section to “Anyone with the link.”
Then set the access to “Viewer” before clicking the “Done” button. This way, anyone can view the pie chart made from that table in Google Sheets.
3. Copy the link of the Google Sheets document where the table is.
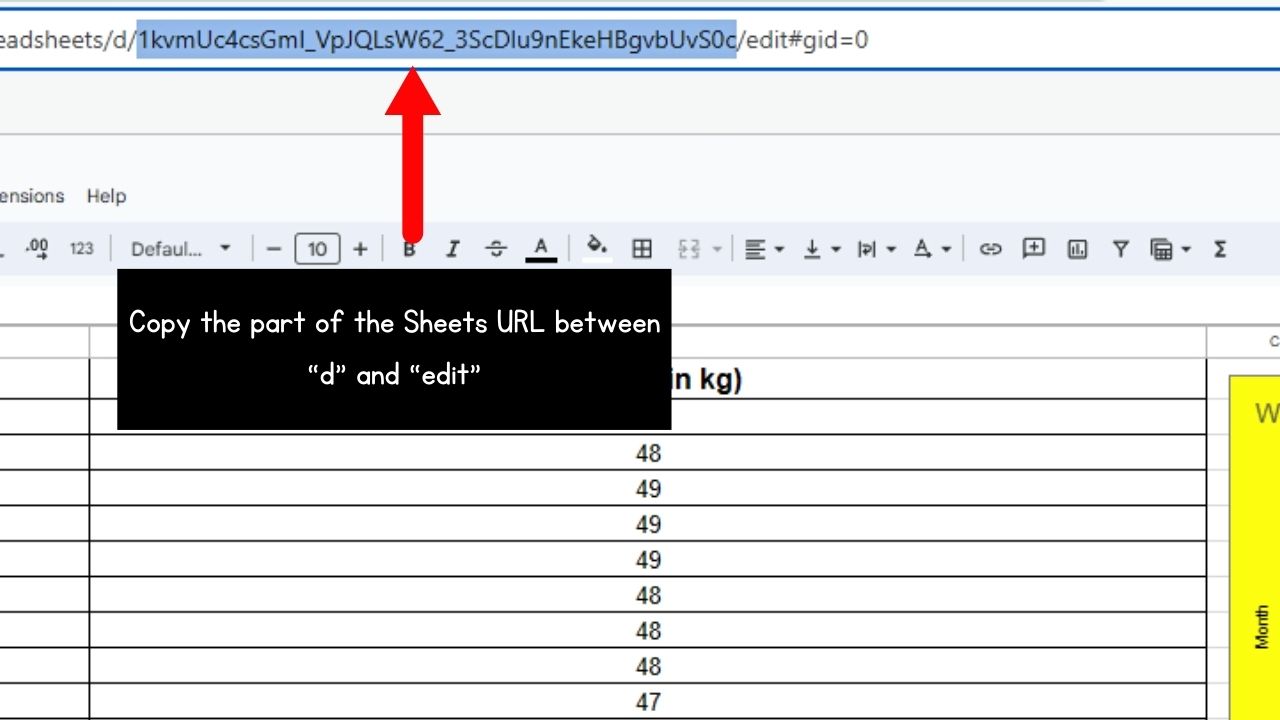
But do not copy the entire link though. You only need the series of numbers and letters between the “/d/” and “/edit” in the Sheets URL.
4. Give the pie chart a title.
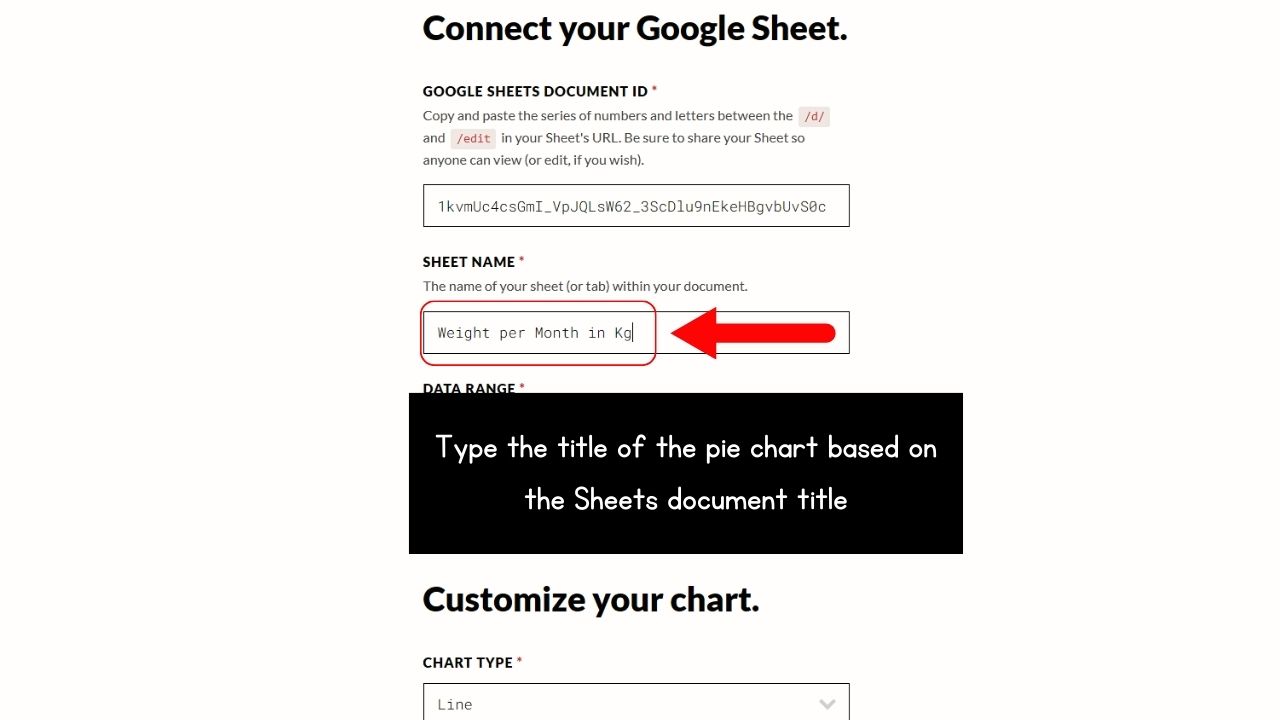
Make sure the title you use is the same as the table’s title in Google Sheets.
5. Select the pie chart’s data range.
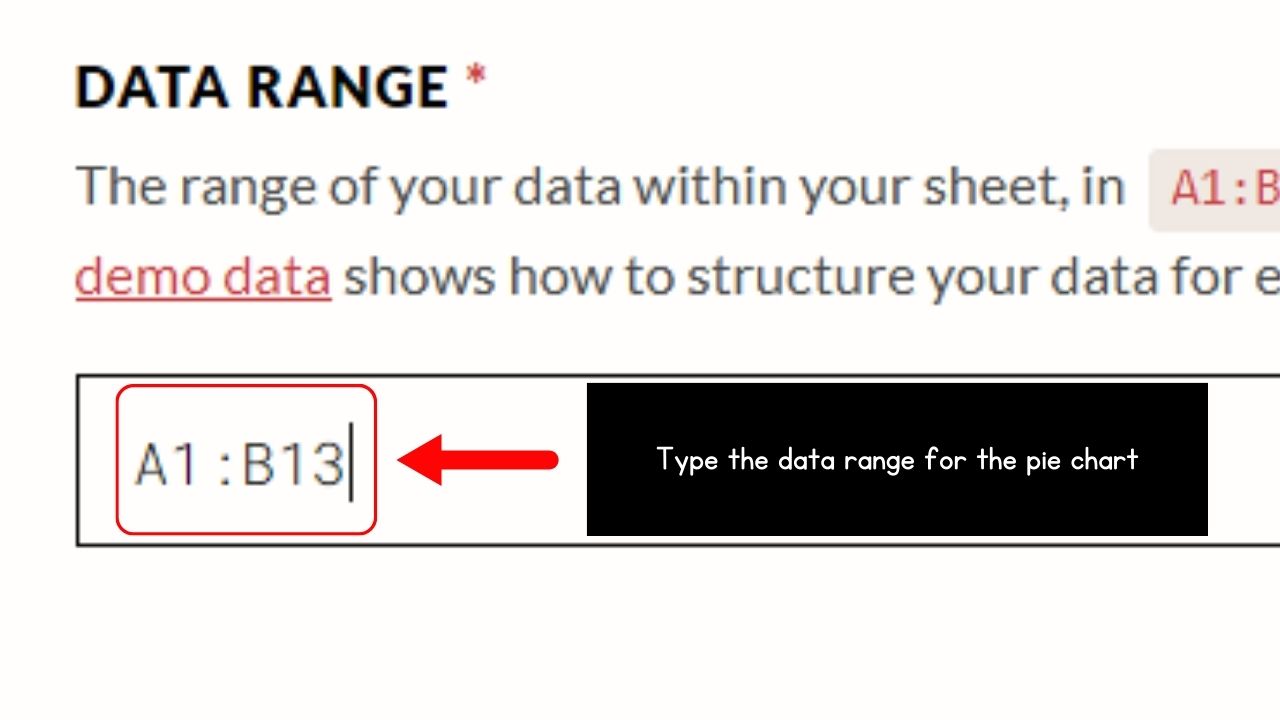
Go to the “Data Range” field and manually type the data using the “A1:B2: notation. Just make sure to only include the cells with the values.
Leave out the headers of the columns.
6. Select “Pie” in the “Chart Type” section.
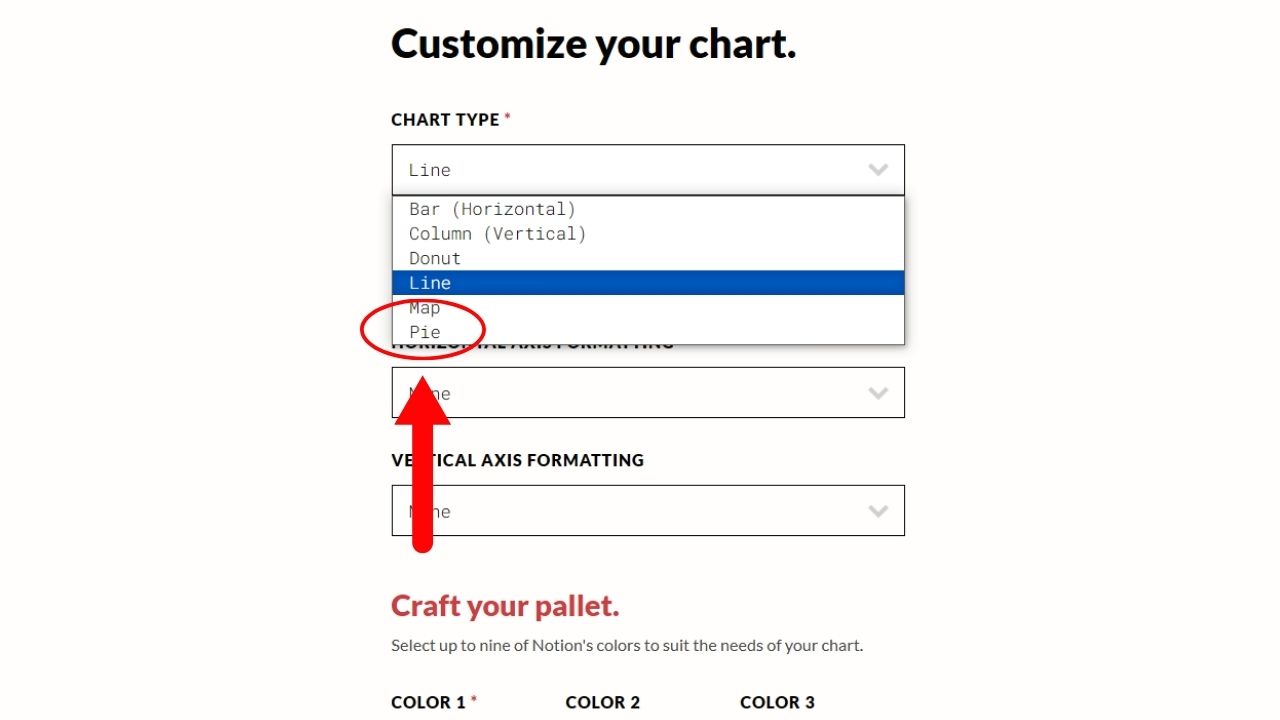
You’ll see this section as the first entry in the “Customize your chart” section.
7. Choose the theme of the pie chart.
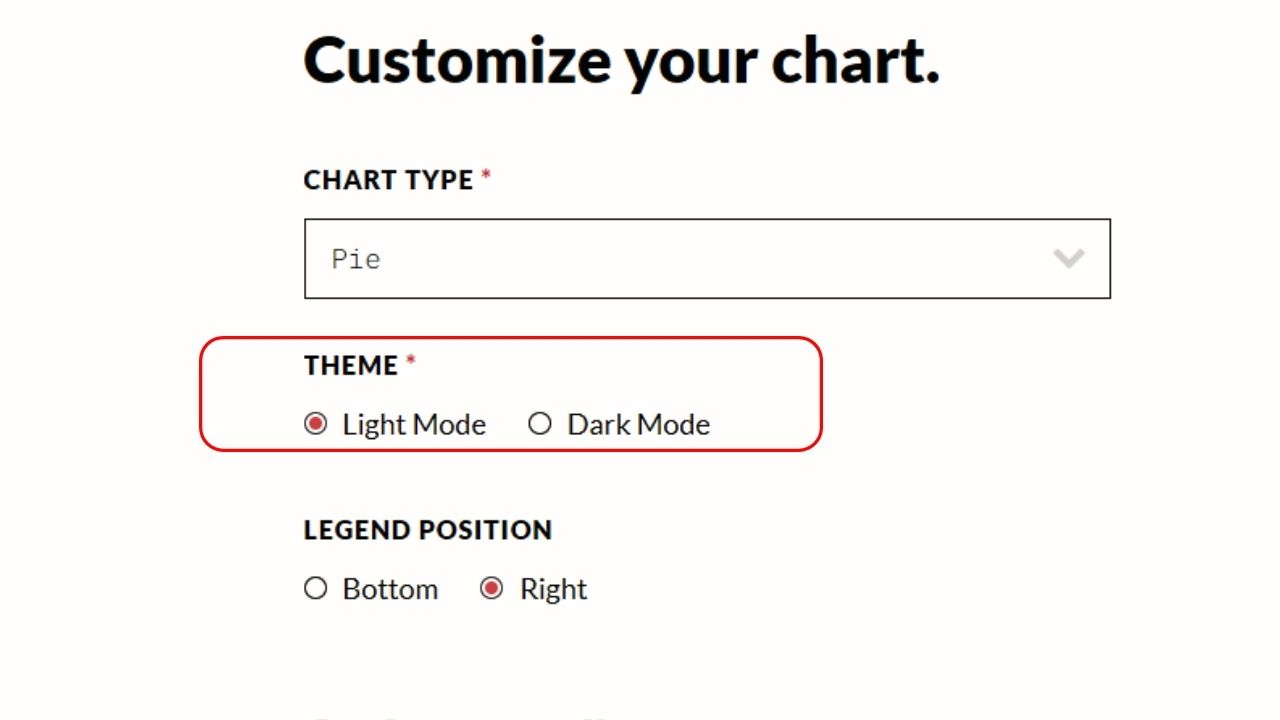
There are only two options you can select in the “Theme” section: “Light Mode” and “Dark Mode.” Simply click on the circle to make the choice.
8. Select the colors of each slice of the pie graph.
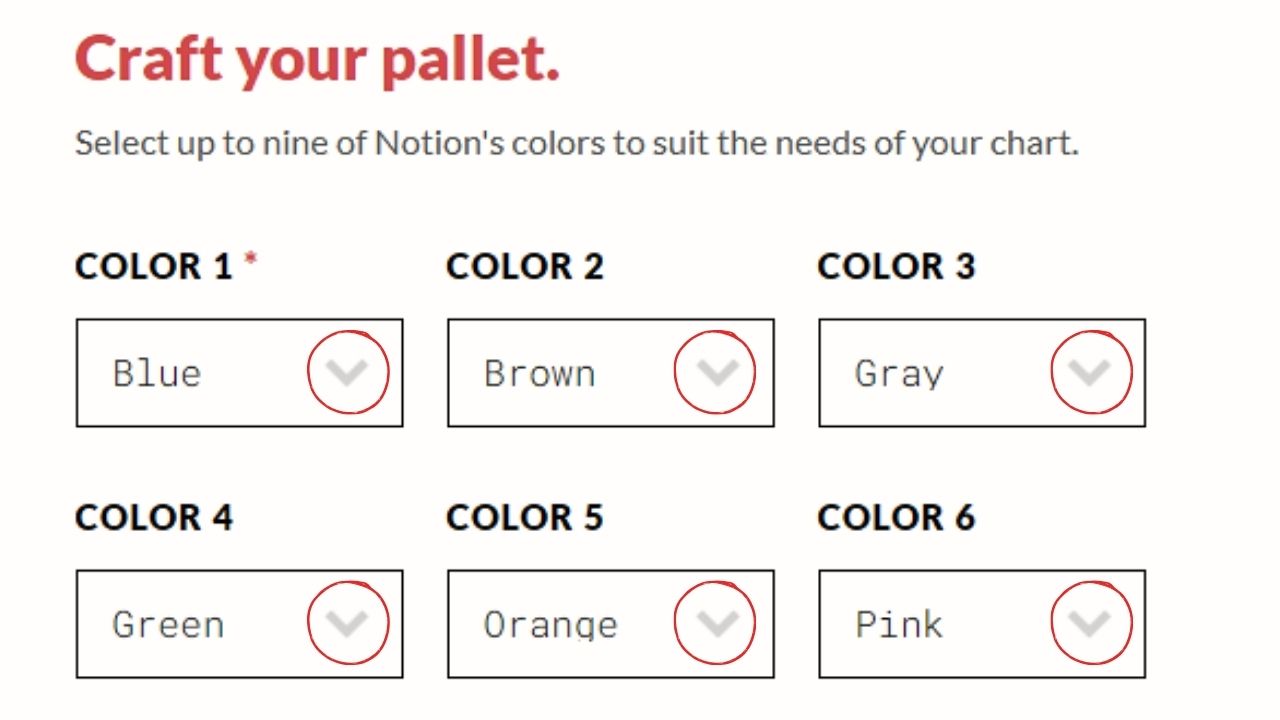
Click on the “Down” buttons of each of the color sections (there are 9 in total) and select the color you’ll use.
9. Click the “Make Magic” button.
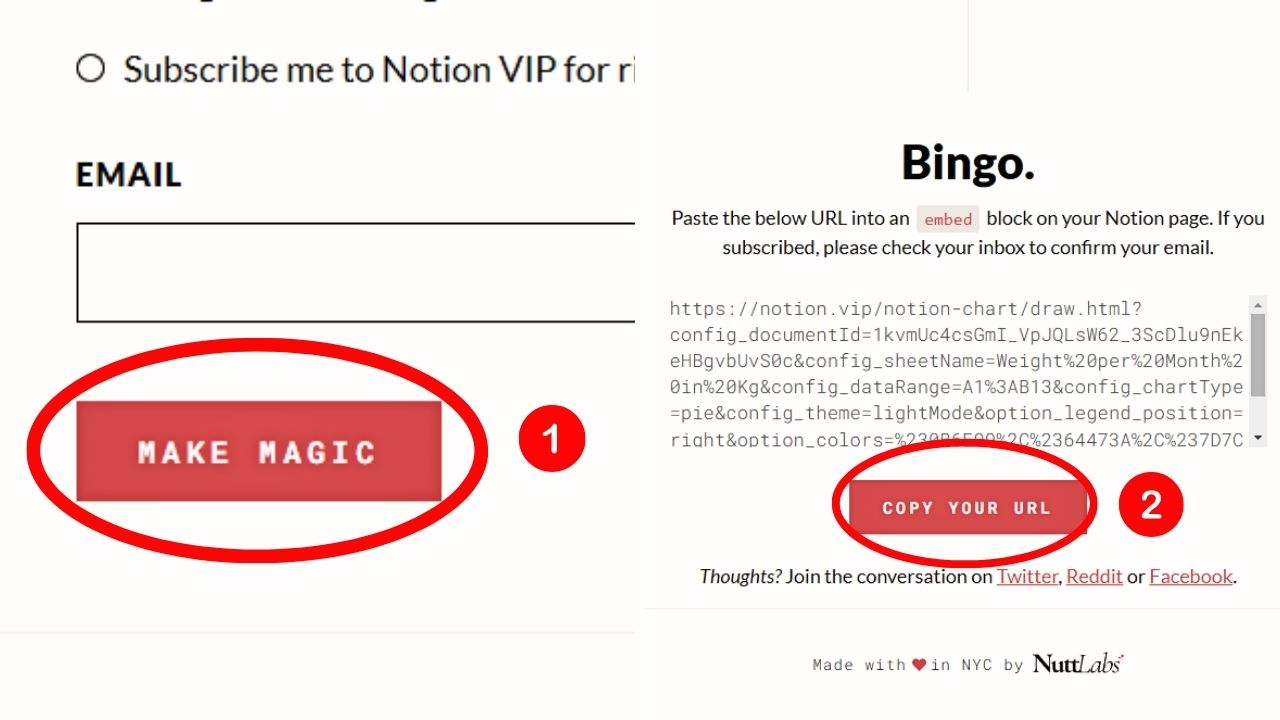
Notion Charts then generates the embed code for the pie chart. Then click “Copy Your URL” to quickly copy the URL of the pie chart.
10. Open an embed block in Notion and paste the pie chart’s embed code.
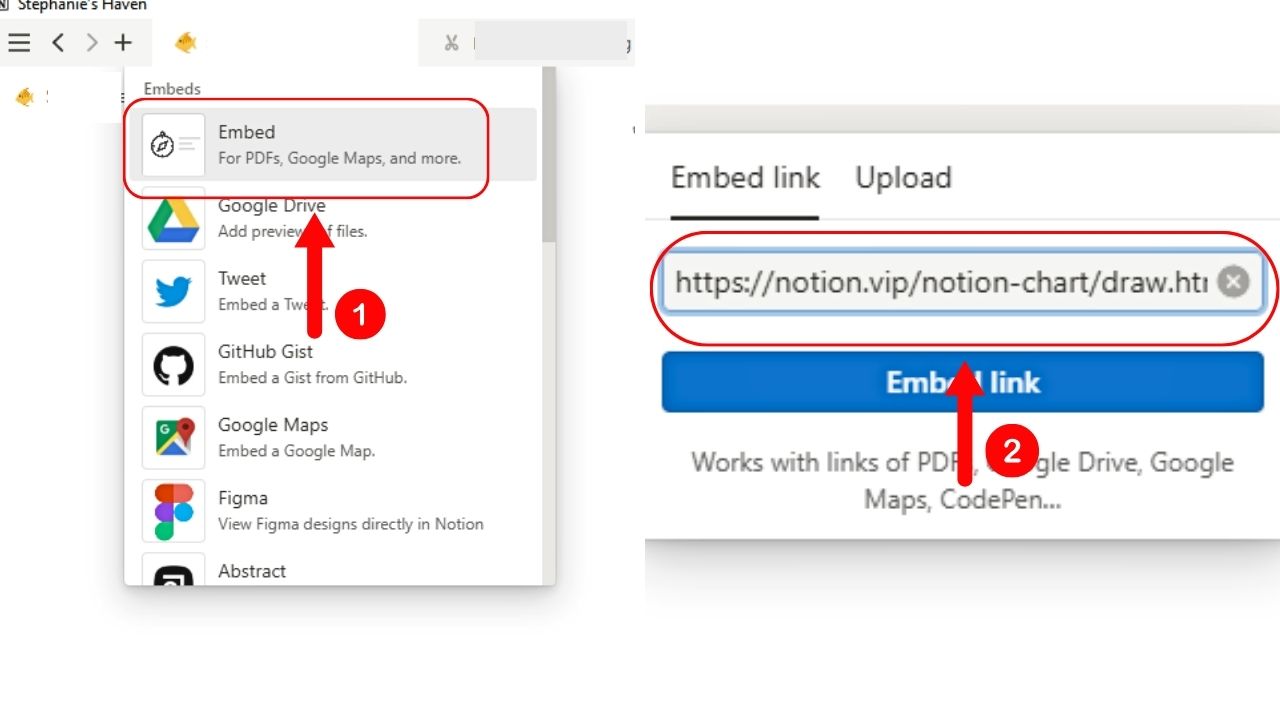
The easiest way to do this is by typing the slash command “/embed” on a blank space and selecting the “Embed” option.
Then embed the link in the URL field.
11. Click “Embed Link.”
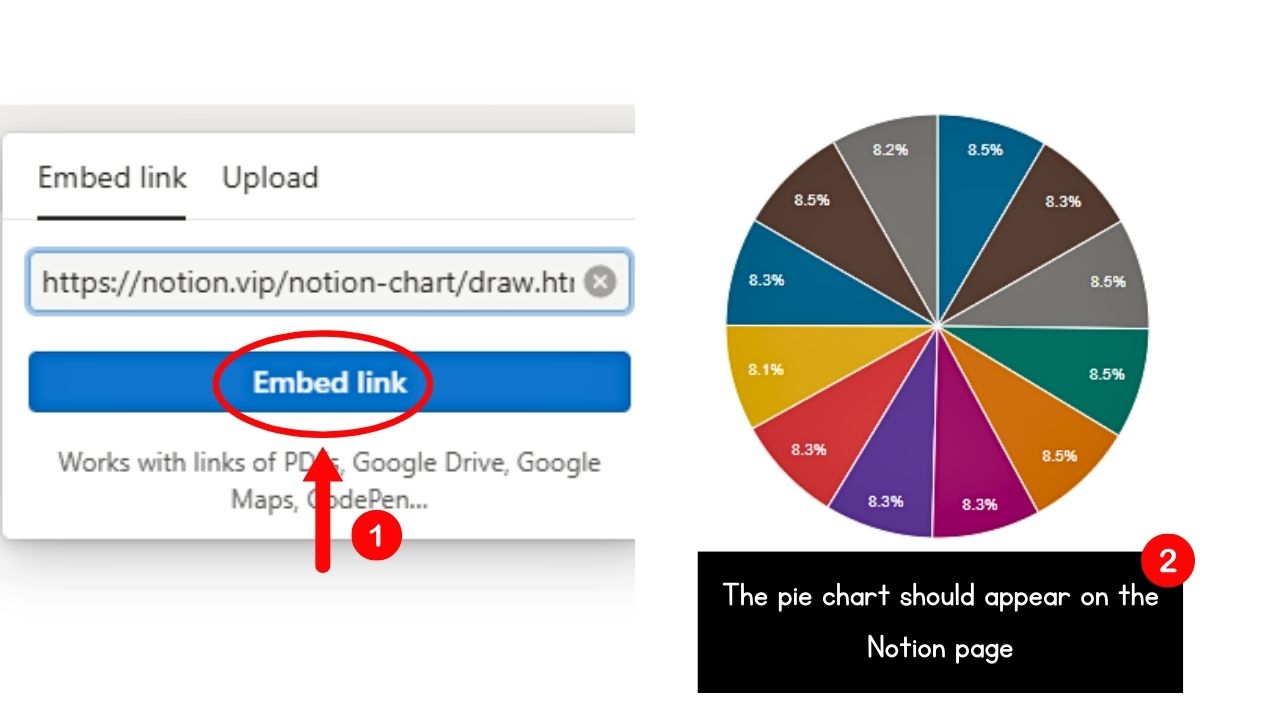
You’ll find this button below the URL field of the embed block you opened. The pie chart should now appear on the Notion page after a few seconds.
How to Make a Pie Chart in Notion Using Code Blocks
A new feature added to Notion that allows its users to make diagrams and charts are code blocks. This includes using the “Mermaid” coding language.
This way, you don’t have to leave Notion to create a pie chart.
1. Open a code block on the Notion page.
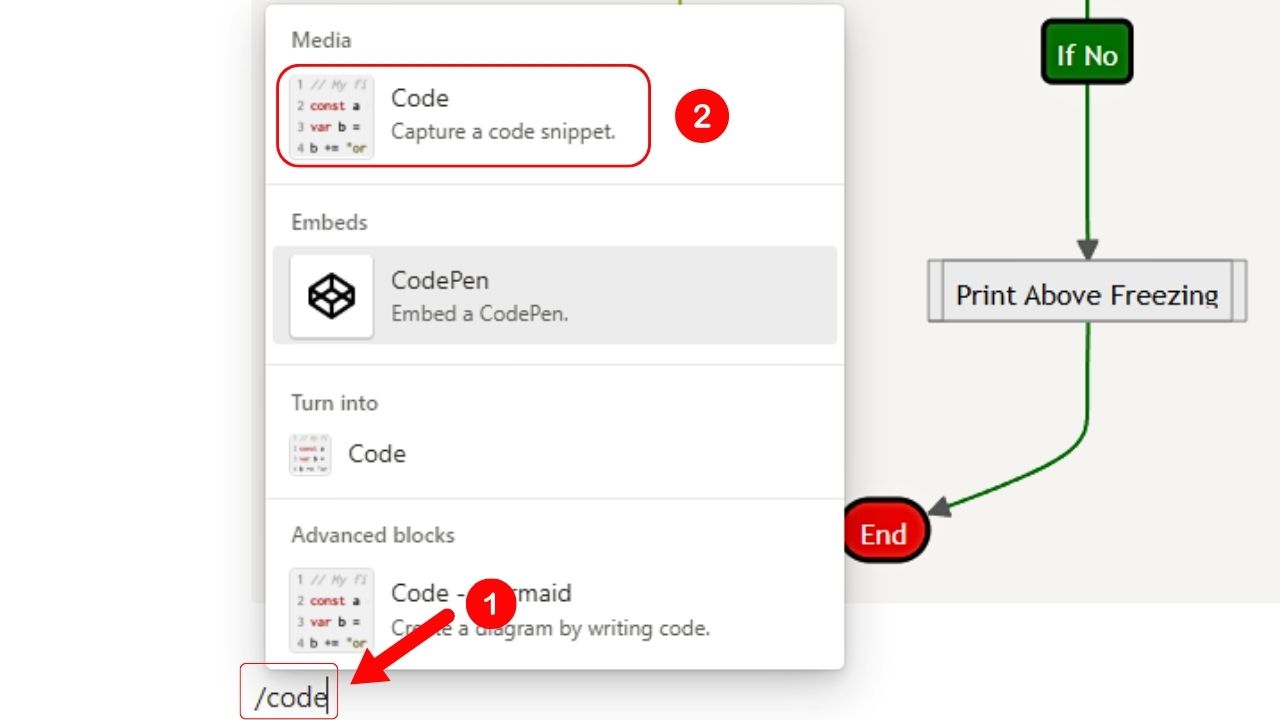
Do this by typing “/code” in a space. Then select the “Code block” option on the dropdown menu.
An empty code block should now open.
2. Select “Mermaid” as the coding language.
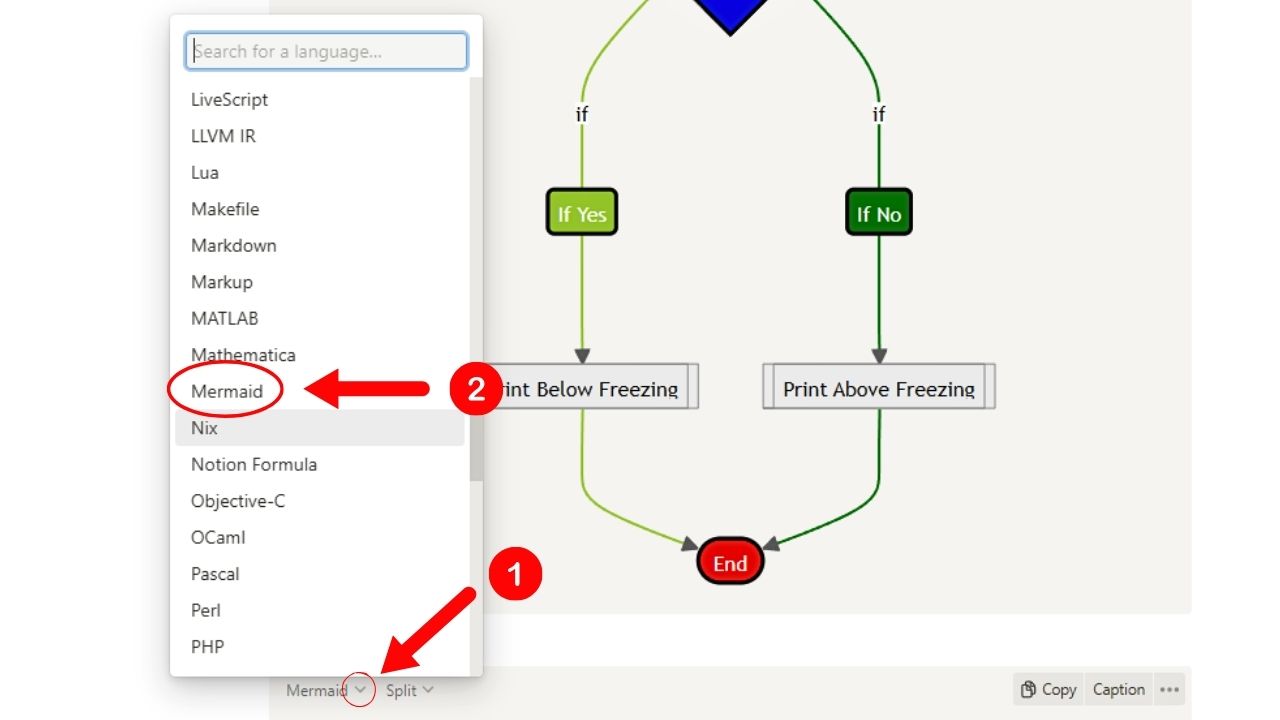
Click the “Down” button of the “Coding Language” toggle menu and select “Mermaid” from the list.
A new toggle menu then appears on its right side.
3. Select a display option you want to use while coding.
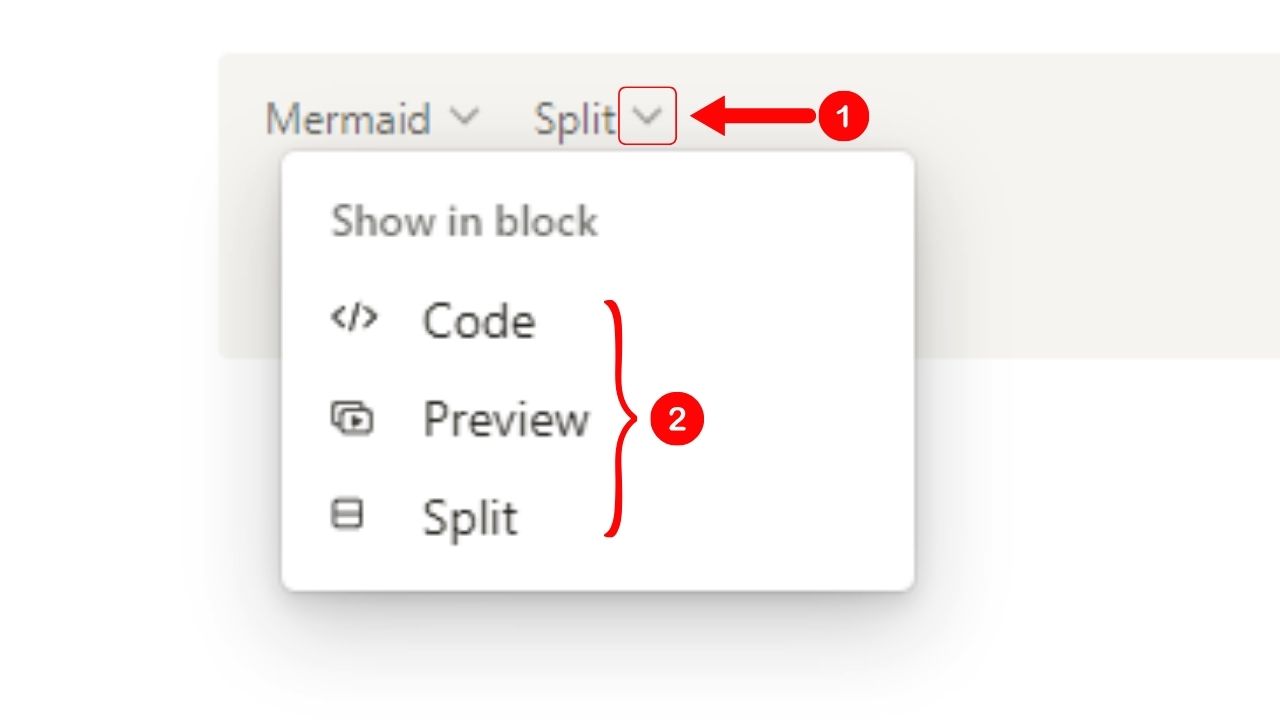
There are 3 display options available: “Code,” “Preview,” and “Split.
If you want to see only the codes, select “Code.” If you want to see only the pie chart, click “Preview.”
But if you prefer to see both the coding and the pie chart at once, select “Split.”
4. Type “pie” in the code block.
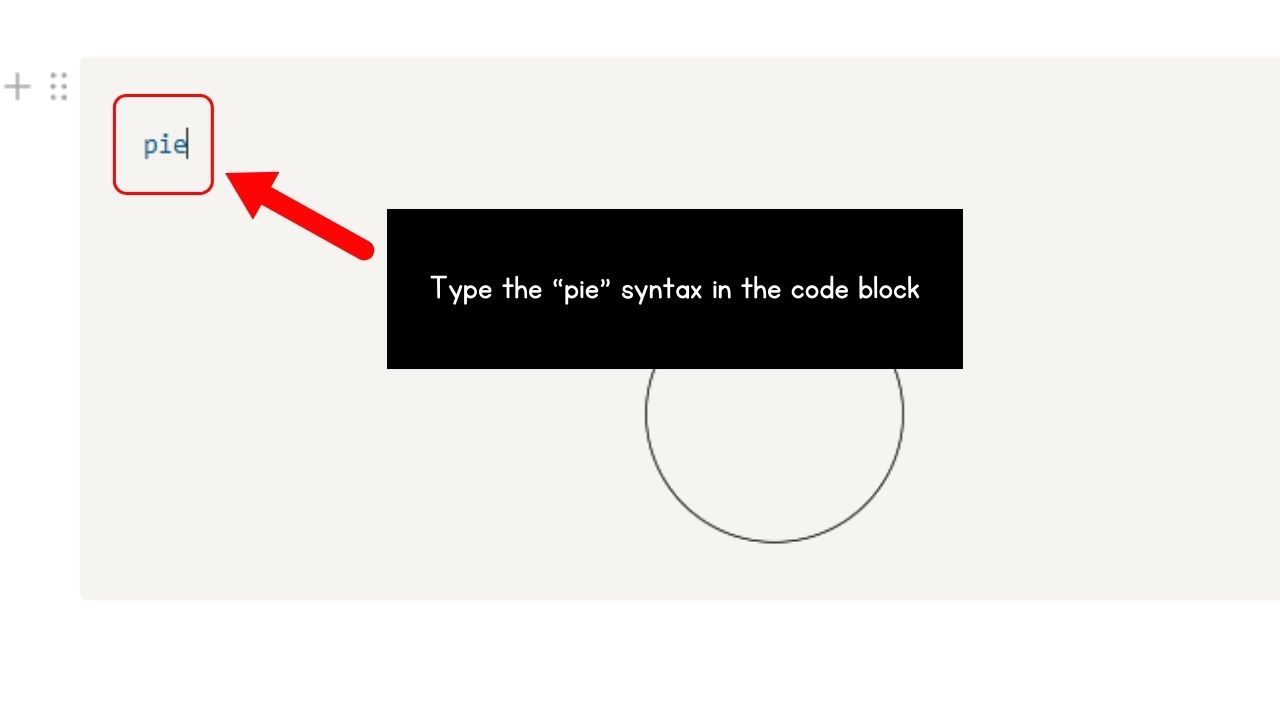
This is the syntax for making the pie chart inside the code block using the Mermaid language.
5. Press the “Enter” and then the “Tab” keys.
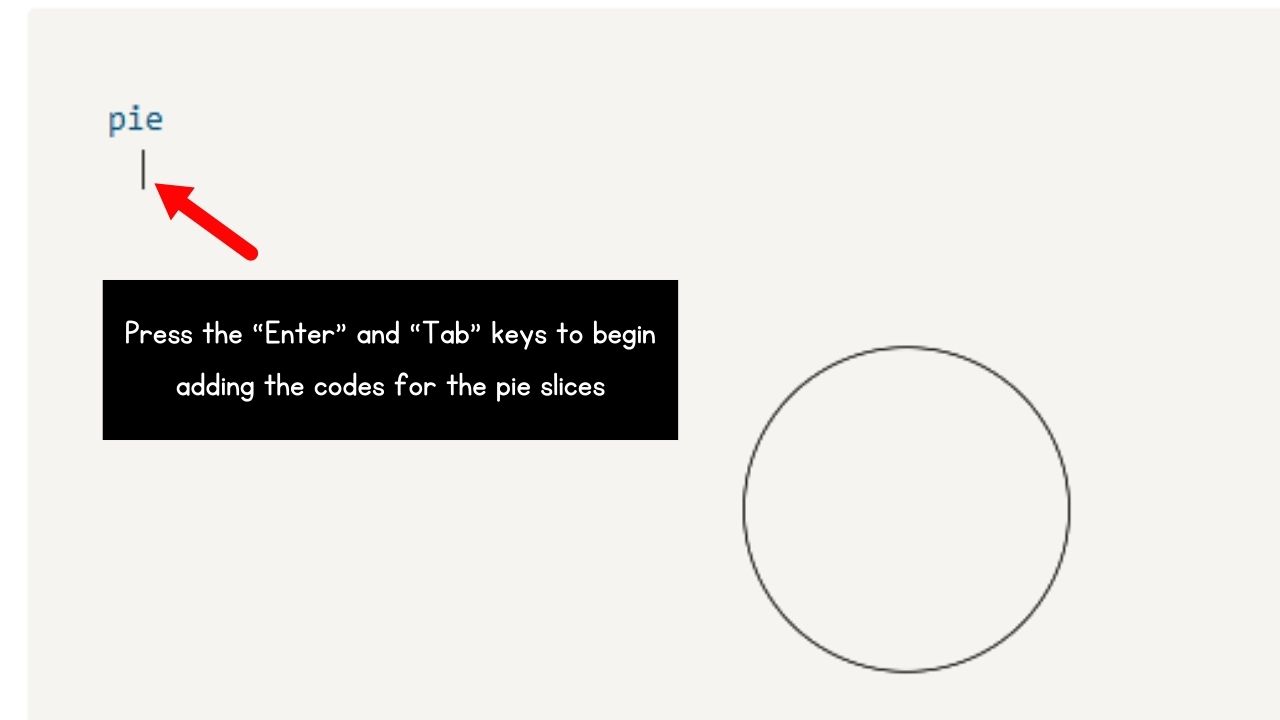
Pressing “Enter” adds a new code line, while tapping “Tab” allows for entering the slices of the pie chart.
6. Add the labels for the pie chart slices and their corresponding share.
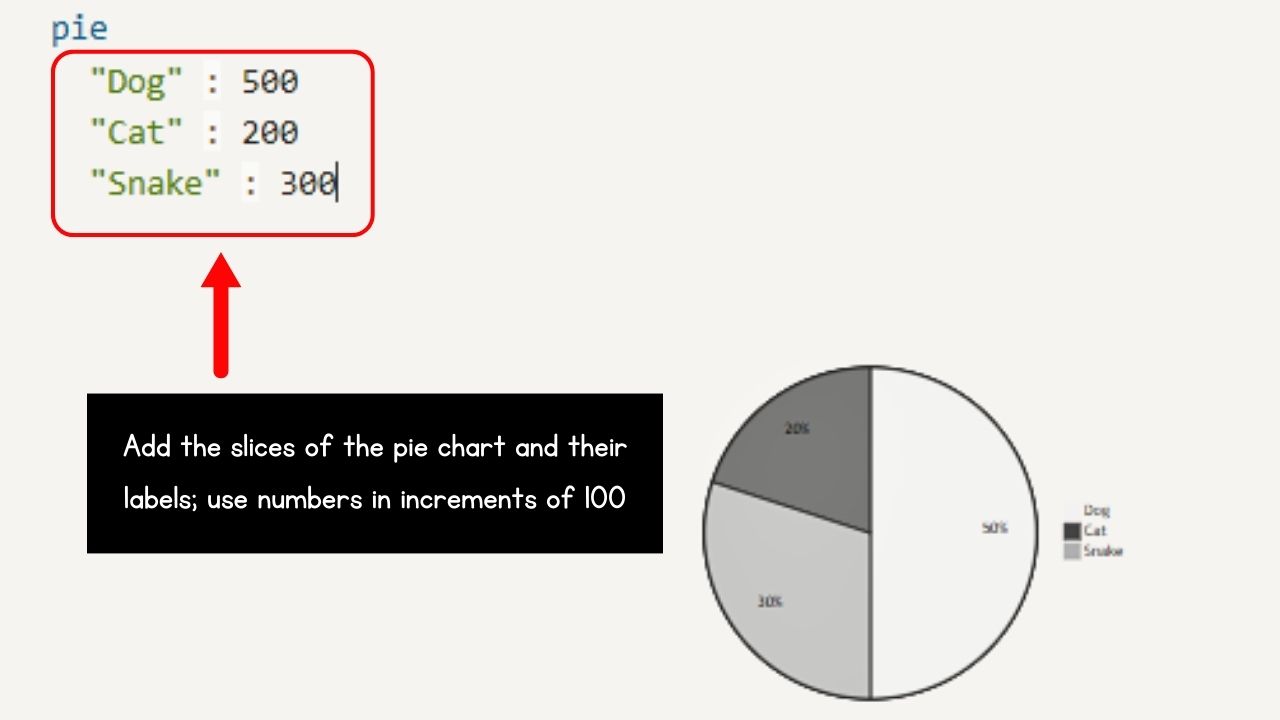
Do this by enclosing each slice label in quotation marks. Then add a space and a colon before typing the share of that slice on the pie chart.
Repeat until all the entries to the pie chart are added. After that, you should see the pie chart with all the slices and their legend generated in the code block.
7. Give the pie chart a title.
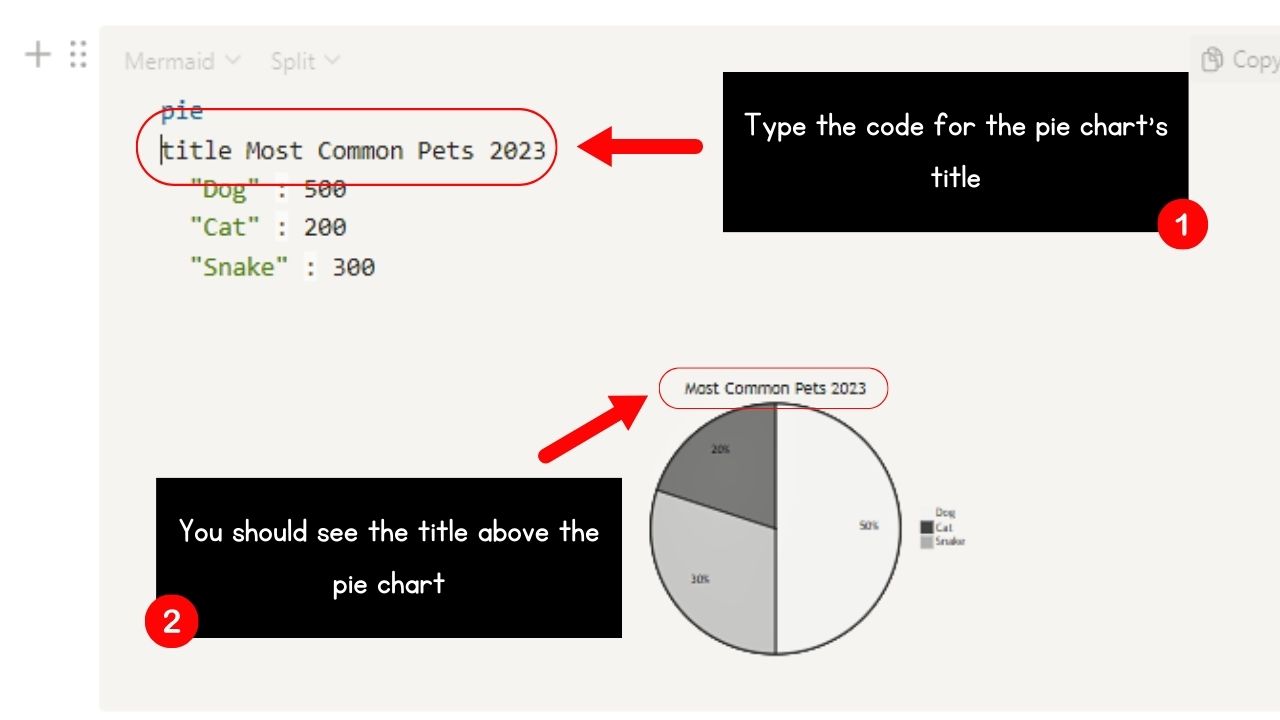
Pie charts and other graphs like line graphs need a title so the readers know what that chart or graph is all about.
Do this by adding a space then type “title.” From there, you can add the title of the pie chart. You should now see the title above the pie chart generated.
8. Show the data of your pie chart by adding the “showData” syntax.
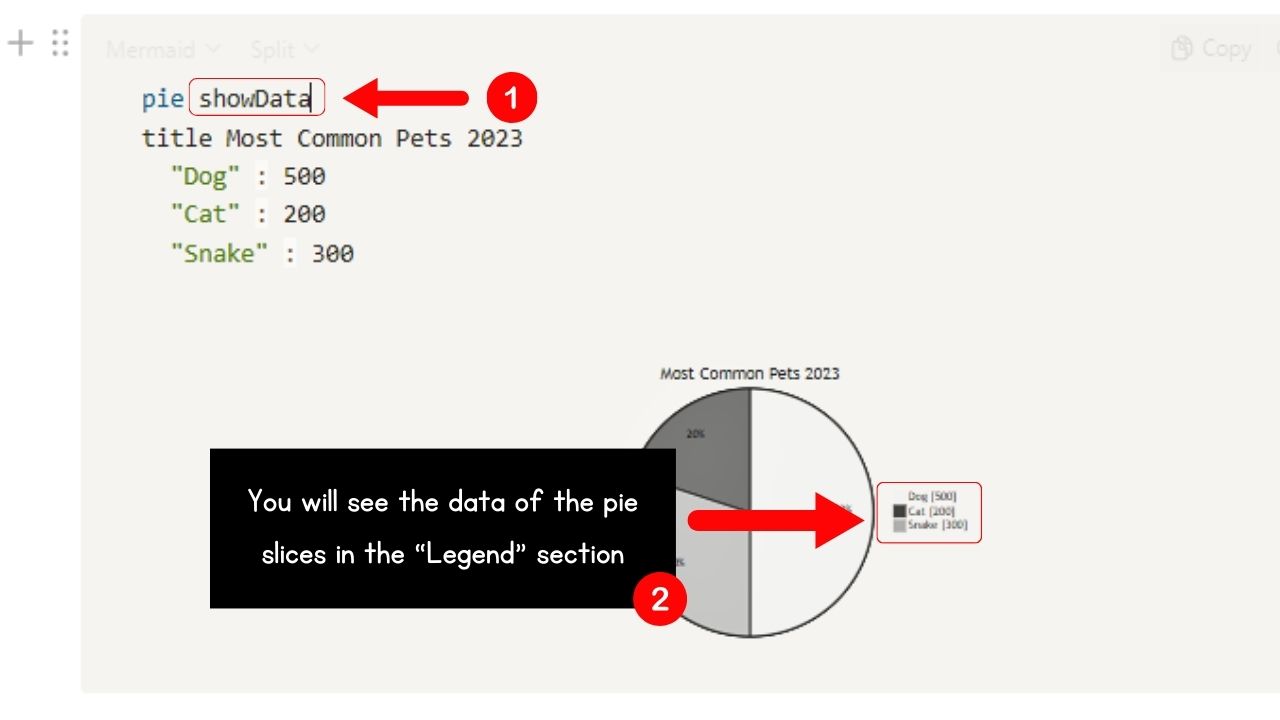
But before you add this new syntax, you have to move the “title” code one line down. Press “Enter” to do this.
Then add a space after “pie” and type “showData.” You should now see labels appear beside the entries in the “Legend” area.
9. Add colors to the slices of the pie chart.
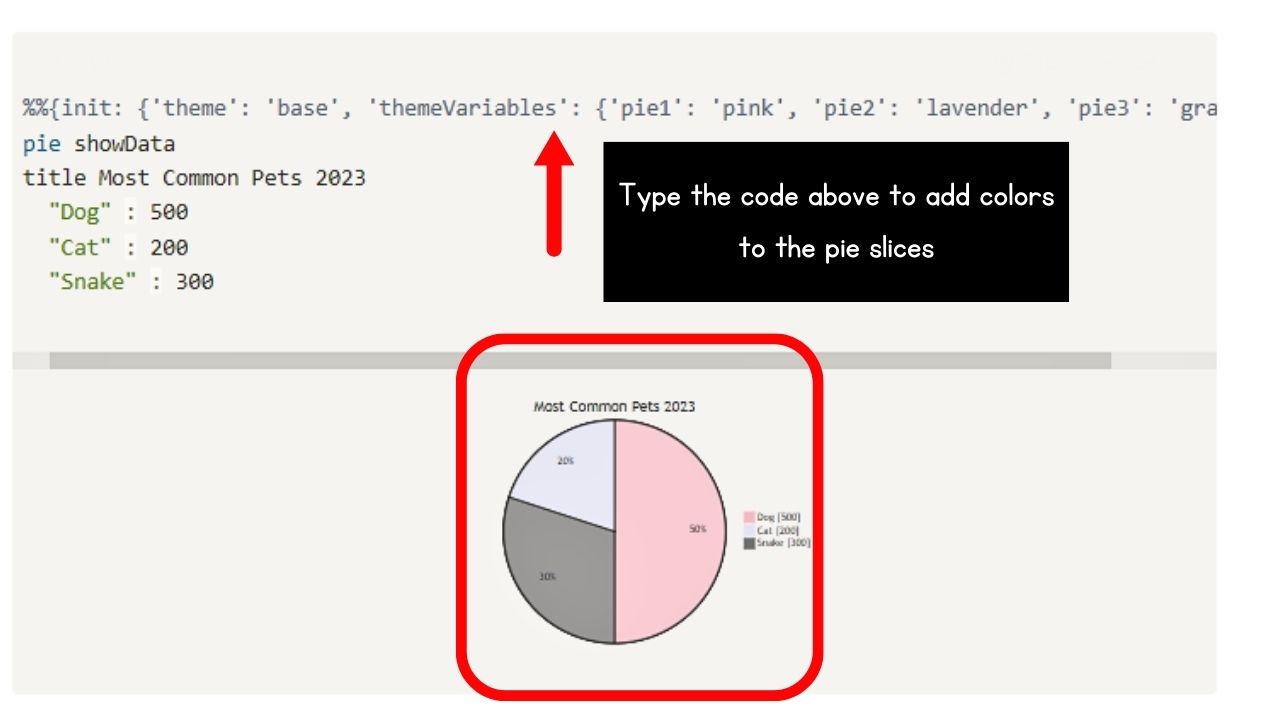
Do this by adding Mermaid directives. These change the configuration of the mermaid chart so you can change how it looks.
Specifically speaking, they add colors to the chart by themes.
Place the directive above the “pie” syntax. Then type the following code:
%%{init: {‘theme’: ‘base’, ‘themeVariables’: {‘pie1’: ‘color1’, ‘pie2’: ‘color2’, ‘pie3’: ‘color3’}}}%%
10. Change the font style used for the pie chart.
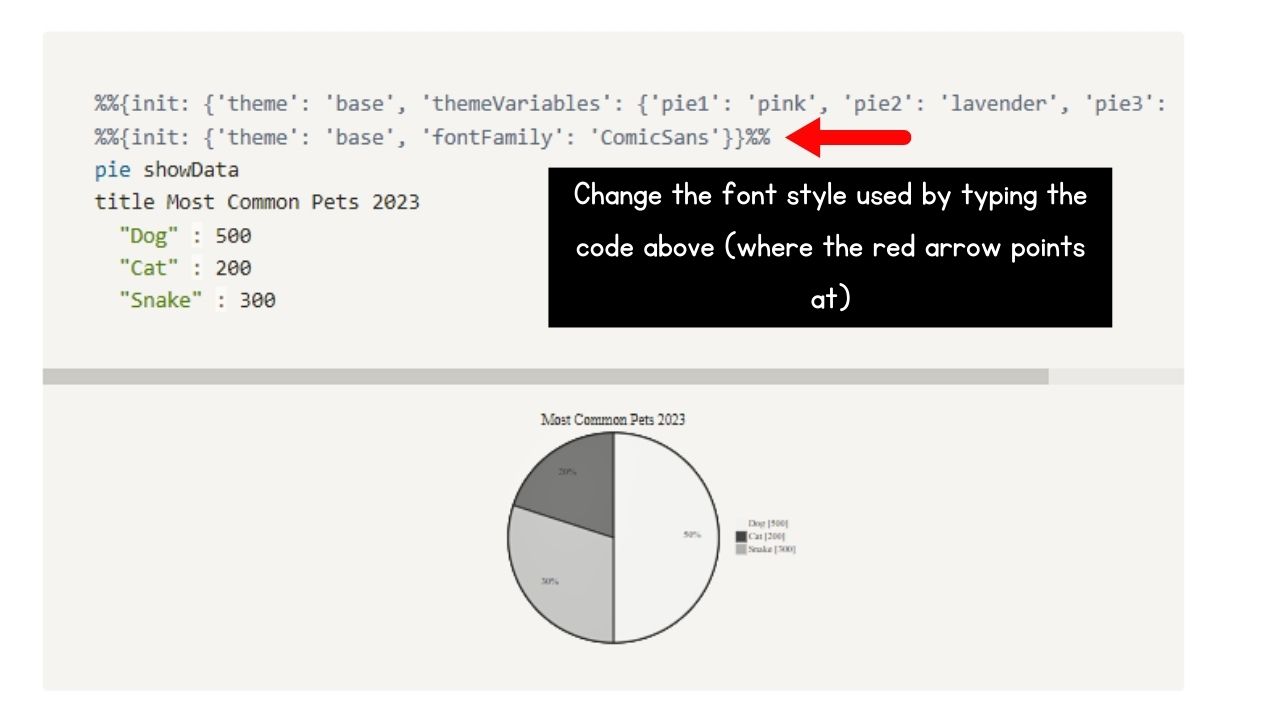
Though this step is optional, you can change the font setting of the text in the pie chart by typing this code:
%%{init: {‘theme’: ‘base’, ‘fontFamily’: ‘name of font family’}}%%
Conclusion
Now that you’ve mastered how to make a pie chart in Notion, you can present percentage data visually. You can embed charts into your Notion workspace by creating them in Google Sheets or using code blocks or a third-party chart maker.
You can add data magic to your Notion projects to make them more fun for your colleagues and classmates.
